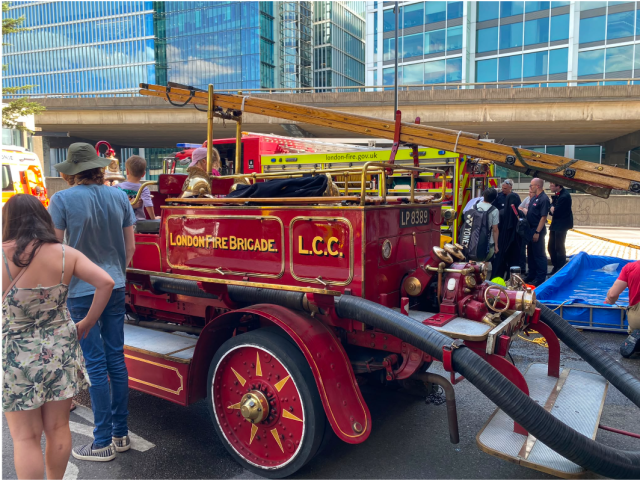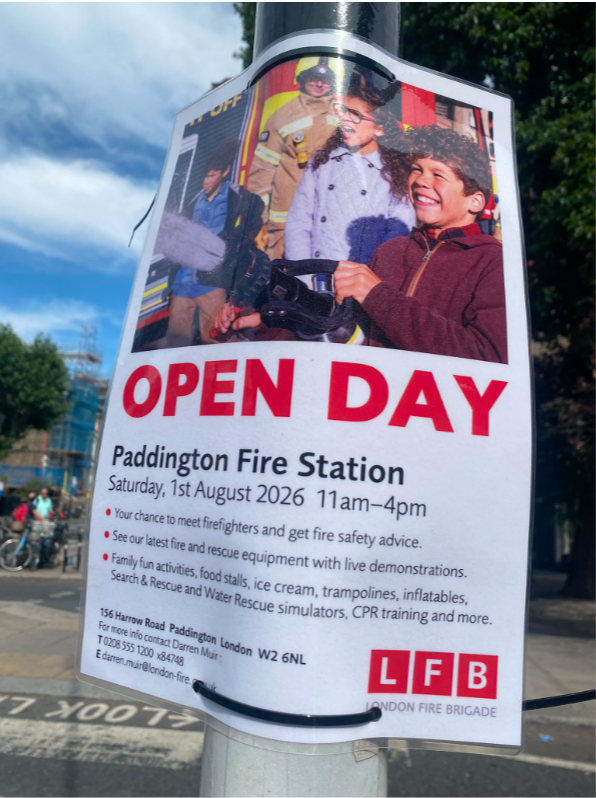
After attending an Open Day at Paddington Fire Station today – my local fire station – l have been persuaded more than ever that we need to expanding the London Fire Brigade (LFB) into a broader climate adaptation and resilience force. Involving shifting from a purely reactive emergency response to a proactive climate-resilient civic defender.
As London Fire Service (LFB) responds to heatwaves, flash flooding, and urban wildfires become more frequent and intense, expanding the Brigade’s statutory and operational mandate involves key structural and strategic approaches:
1. Statutory Mandates & Legislation
Currently, the Fire and Rescue Services Act 2004 obligates fire services to respond to fires and road traffic collisions, but flooding and major climate events are not statutory duties across England.
- Statutory Duty for Flooding: Making flood response and climate adaptation legally binding statutory duties for LFB would unlock earmarked central funding, mandatory cross-agency integration, and defined resource minimums.
- Reform the Civil Contingencies Act: Strengthening the local framework through the London Resilience Forum would mandate fire services to participate directly in multi-hazard climate adaptation strategies, rather than acting only when a disaster escalates.
2. Operational Adaptation & Specialised Assets
Responding to climate-driven emergencies requires distinct operational tools and tactical expertise compared to structural fires:
- Targeted Fleet & Gear Investment: Introduce lightweight off-road wildfire response vehicles, high-capacity water pumping appliances for urban flash flooding, and heat-adapted personal protective equipment (PPE) tailored for extreme temperatures.
- Predictive Modelling & Micro-Risk Mapping: Partner with environmental agencies and universities to integrate real-time satellite data and predictive heat-island/flood models into LFB dispatch systems.
- Dedicated Climate Resilience Units: Establish specialised teams within fire stations focused specifically on wildfire management, surface water flooding, and structural collapses caused by extreme weather.
3. Expanding the Prevention & Protection Framework
The LFB’s existing Prevent & Protect framework (which traditionally handles home fire safety checks and building compliance) can be broadened into a broader community resilience program:
- Climate Safe Home Visits: Expand standard home safety checks to assess vulnerabilities to flash flooding, extreme indoor heat, and poor ventilation—especially for vulnerable populations.
- Building Safety & Retrofitting: Audit urban developments for climate hazards—such as green roof fire safety, sustainable drainage integration, and heat resilience in high-rise buildings.
4. Workforce Upskilling & Community Engagement
- Mandatory Climate Emergency Training: Roll out comprehensive modules across operational staff covering environmental impact, flood rescue, and wildfire suppression techniques.
- Community Resilience Volunteers: Train local volunteer networks attached to neighbourhood fire stations to act as first-line community responders during extreme heatwaves or storm surges.
| Challenge | Practical Solution |
| Funding & Budget Constraints | Secure joint funding from the Greater London Authority (GLA), climate adaptation funds, and central government climate resilience budgets. |
| Staff Overstretch & Burnout | Increase baseline staffing levels to prevent firefighter exhaustion during prolonged extreme weather events. |
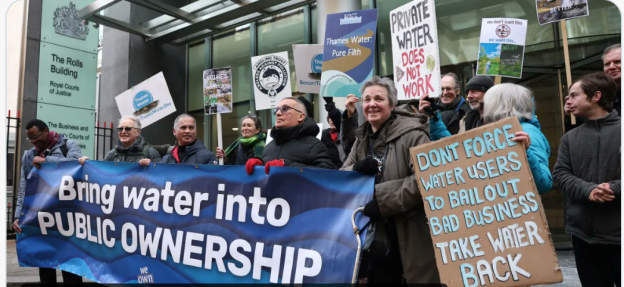
| Inter-Agency Coordination | Formalise operational ties between LFB, the Environment Agency, Thames Water, and London Boroughs through joint simulation exercises. |
Expanding the London Fire Brigade (LFB) into a climate resilience force requires navigating a complex financial environment. The LFB faces a structural core funding gap alongside a multi-million-pound shortfall specifically earmarked for achieving its Net Zero 2030 climate goals.
Funding this expansion cannot rely on standard operational budgets alone. It demands a combination of statutory reform, localised revenue generation, and innovative green financing.
1. Statutory & Central Government Funding
The most sustainable path to funding requires central government alignment, shifting climate response from an “ad-hoc emergency” to a legally mandated duty.
- Statutory Flood & Wildfire Grants: Currently, the LFB campaigns to make flood response a statutory duty under the Fire and Rescue Services Act 2004. If formalised, this would legally compel the Home Office and the Department for Environment, Food & Rural Affairs (DEFRA) to provide dedicated, ring-fenced national grant funding for specialised equipment (like high-volume pumps and all-terrain wildfire vehicles).
- The UK National Resilience Framework: Accessing central funding via the Cabinet Office’s resilience budgets. By integrating the LFB deeper into the London Resilience Forum, the brigade could draw from national emergency preparedness capital grants rather than its standard localised budget.
2. Devolution & Local Tax Mechanisms
Under the Greater London Authority (GLA) model, the Mayor of London has mechanisms to generate regional revenue specifically for the capital’s safety.
- The Council Tax Precept (Climate Safety Levy): The Mayor currently funds the LFB largely through Retained Business Rates and the Council Tax Precept. To fund climate adaptation, the GLA could introduce a temporary “Resilience Precept” or maximise the allowable annual increase (historically capped around 3% without a referendum) specifically ring-fenced for climate assets.
- Business Rate Levies on High-Risk Sectors: A fraction of a percent surcharge on business rates for large commercial properties in high-risk zones (e.g., surface-water flood zones or the Wildland-Urban Interface along London’s edge lands) could directly fund localised mitigation and protection assets.
3. Innovative Green Financing & Insurance Partnerships
Rather than relying solely on taxpayers, the LFB can leverage the financial value of the risk reduction it provides.
- Insurance Industry Levies (The “Resilience Dividend”): Commercial and property insurers benefit directly when the LFB successfully mitigates flash floods or prevents urban wildfires from spreading. A partnership model—similar to the UK’s Flood Re scheme—could see a micro-levy on property insurance policies in London funnelled directly to the LFB to fund preventative infrastructure and protection teams.
- Municipal Green Bonds: The GLA could issue dedicated “London Climate Resilience Bonds.” Institutional and retail investors buy these bonds to fund green capital projects. For the LFB, this capital would fund the heavy upfront costs of transitioning to an eco-friendly fleet (like Zero Emission Pumping Appliances) and retrofitting fire stations into climate-resilient community hubs.
4. Cross-Agency Shared Budgets
Climate adaptation crosses institutional boundaries, meaning budgets should too.
- Co-Funding with Utilities (Thames Water): Because surface water management involves both drainage infrastructure and emergency pumping, joint capital funds can be established. Thames Water and the LFB could co-fund specialised multi-agency units that handle flood prevention and real-time mitigation, spreading the operational cost.
- Developer Contributions (Section 106 & CIL): The Community Infrastructure Levy (CIL) charged on new London property developments could be adjusted. A portion of these developer fees in vulnerable areas would be automatically allocated to the LFB to offset the increased climate risk profile of new high-density districts.
The Reality Check: Frontline costs and statutory requirements already absorb roughly 86% of the LFB’s annual expenditure, leaving almost no room for internal savings to fund new initiatives. Expanding into climate resilience cannot happen via internal restructuring; it fundamentally requires new revenue pipelines.
The London Fire Brigade’s Sustainable Development Strategy (2026–2030) builds on the Mayor of London’s goal of making the capital carbon net zero by 2030.
Instead of treating environmental sustainability as a secondary concern, the strategy embeds climate decision-making directly into everyday operations, estate upgrades, procurement, and emergency response.
Strategic Pillars & Key Priorities
1. Estate Decarbonisation & Electrical Upgrades
The LFB operates 103 fire stations across London. To achieve operational net zero by 2030:
- Power Grid Expansion: Upgrading electrical infrastructure across stations (boosting average capacity from ~140 amps to 800 amps per station). This 600% capacity increase provides the backbone needed to phase out fossil fuels.
- Eliminating Gas Dependency: Phasing out gas-powered bay heaters, boilers, and cooking equipment in favor of air-source heat pumps, induction cooking, solar power, and LED systems.
- Net-Zero Station Model: Building on pilots like Walthamstow (London’s first net-zero carbon fire station featuring green roofs and air-source heat pumps), retrofits are being rolled out across the wider estate.
2. Fleet Decarbonisation & Next-Gen Assets
Transportation is a primary carbon source for the Brigade.
- ZEPA (Zero Emission Pumping Appliances): Expanding trials and deployment of zero-emission electric fire engines tailored to urban response.
- EV Charging Infrastructure: Installing rapid charging points across fire stations to power both operational response vehicles and support fleets.
- Shared GLA Charging Network: Station charge points are being designed to allow access by partner agencies (such as the London Ambulance Service) to maximize public land utility.
3. Operational Climate Readiness
- Station-Level Hazard Plans: Developing localised station plans tailored specifically to emerging climate hazards in each borough—such as Wildland-Urban Interface (WUI) risks in outer London and flash-flood zones in low-lying inner-city areas.
- Specialised Training: Rolling out mandatory climate emergency and “Environment Matters” training across operational crews to adapt tactics for extreme heatwaves, wildfire suppression, and flood rescue.
- Pre-Decision Impact Assessments: Every major policy, project, and budget proposal must undergo a Sustainable Development Impact Assessment (SDIA) to evaluate environmental and social impacts before funding is approved.
4. Circular Economy & Sustainable Procurement
- Green Supply Chains: Requiring key contractors and equipment providers to meet strict social value and low-carbon standards, utilising Cabinet Office tools (like MSAT) to ensure ethical and sustainable sourcing.
- SME & Local Business Spend: Directing spending toward local small and medium-sized enterprises (targeting over one-third of total supplier spend) to drive regional green economy growth.
- Cross-Sector Partnerships: Collaborating through the UK Emergency Services Sustainability Charter and the London Anchor Institutions’ Network to pool purchasing power and share climate resilience best practices.
Key Operational Takeaway: The core philosophy of the 2026–2030 strategy is that sustainability directly enhances operational resilience. Eliminating gas reduces station reliance on vulnerable supply chains, upgrading local power capacity ensures energy security during extreme weather power cuts, and preparing crews for severe weather directly protects firefighters on the front line.